Simpson's paradox: why you should not “control for everything”
We are taught that correlation does not imply causation. For instance, if we take a random sample of the population, we are likely to discover that having yellow teeth is positively correlated with developing lung cancer. Does this imply that yellow teeth causes lung cancer? No. When controlling for smoking, we should expect the correlation to disappear. That is: if we partition our sample into smokers and non-smokers, we shall expect to find that smokers with yellow teeth are no more likely to develop lung cancer than smokers in general, and that non-smokers with yellow teeth are no more likely to develop lung cancer than non-smokers in general. Rather, the story goes, the correlation between yellow teeth and lung cancer is best explained by smoking being a common cause of both.
In principle, however, our data is also consistent with the alternative hypothesis that smoking actually prevents lung cancer, and that there is some other property ─ having a certain gene, say ─ causing both smoking and lung cancer.¹ Perhaps people with the gene who smoke are less likely to develop lung cancer than people with the gene in general, and people without the gene who smoke are less likely to develop lung cancer than people without the gene in general. This may hold in spite of the fact that people who smoke are more likely to develop lung cancer than people in general.
The aforementioned scenario would be an instance of Simpson's paradox.² In one sense, this kind of scenario is ubiquitous: in practically any sample revealing a correlation between two properties A and B, it is possible to find a property C that, when controlled for, reverses the correlation. It may not be a very “natural” property, but a property nevertheless. To see why, it is sufficient to study the diagram below.
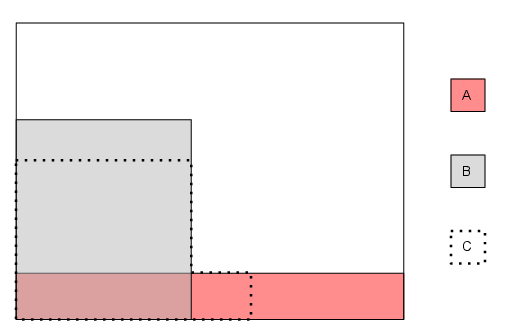
The number of sampled individuals in each category is assumed to be proportional to the area of the corresponding part of the diagram. In probabilistic terms, we have the following:³
This is why you should not ─ strictly speaking ─ “control for everything”.